 |
Author: Dr. phys. Alexei Kuzmin Institute of Solid State Physics University of Latvia Kengaraga street 8, LV-1063 Riga, Latvia Internet: http://www.dragon.lv/eda E-mail: a.kuzmin@cfi.lu.lv |
| About |
The EXAFS Data Analysis software-package, called EDA, allows one to perform all steps of the extended x-ray absorption fine structure (EXAFS) analysis and to obtain structural information on the local environment around the absorbing center. The code was created with the idea to be intuitively simple and fast, guiding the user step by step through each part of the analysis. The EDA package was developed starting from 1988 and was originally running under the MS-DOS compatible operating system. The current version of the code consists of a set of interactive programs running under Windows environment (it was tested by the author under Windows XP/7/10):
Please, read the EDA Manual for more details. |
||||||||||||||||||||||||
Concept |
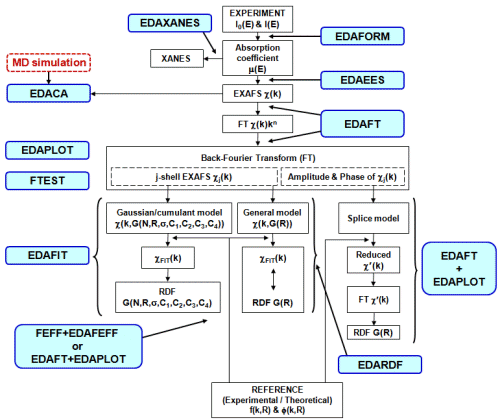
General concept of the EDA package is shown on the scheme below, which illustrates main steps of the analysis and indicates the codes involved: One normally starts with the experimental data (I0 and I are intensities from the ionization chambers, fluorescence detectors, etc), which must be converted into x-ray absorption coefficient by the EDAFORM code (or any other suitable codes one likes to use). Thus obtained x-ray absorption coefficient can be used to separate XANES part, located close to the x-ray absorption edge, by the EDAXANES code or to extract the total experimental EXAFS signal χ(k) by the EDAEES code. After total experimental EXAFS signal extraction, one usually performs its Fouier filtering (i.e. direct and back Fourier transforms (FT) with some suitable "window"-function) to separate contribution from different structural shells (peaks in FT). This is done by the EDAFT code. Such approach allows one to "simplify" the analysis, at least, for the first coordination shell of the absorbing atom. Finally, the EXAFS signal from a single shell can be simulated by different models to obtain structural information.
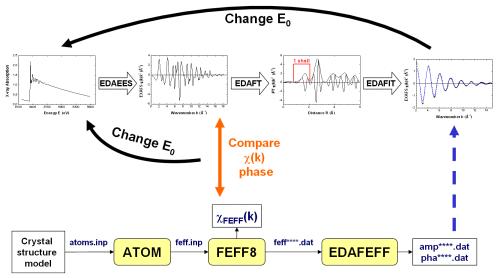
The EDA package allows one to use three models: Different models obtained from the simulations of the EXAFS signal by the EDAFIT code can be further analysed by the FTEST code, applying the Fisher's F0.95 criterion. Finally, visualisation, comparison and simple mathematical analysis of all obtained data can be done using the EDAPLOT code. However, since all data are kept in the simple ASCII format they can be easily transfered to and treated by any other codes. Basic approach to the EXAFS data analysis using the EDA package and theoretical amplitude and phase shift functions, calculated by the FEFF code, is shown on the image below: It is crucial to align the experimental data and the theory on the same wavenumber scale (k-scale), since there is strong correlation between the origin of the photoelectron kinetic energy E0 and the interatomic distances R (both parameters influence the frequency of the EXAFS signal). Therefore, one normally starts from the analysis of the EXAFS signal for the reference compound, whose atomic structure is well known. A good polycrystalline compound with the local structure close to that of the sample under study is a good choice for the reference. As the first trial, one can set the position of E0 at the maximum of the first derivative of the x-ray absorption coefficient and extract the EXAFS signal χ(k): this should be done by the EDAEES code. Besides, one needs to perform calculation of the theoretical total EXAFS signal χFEFF(k) by the FEFF code. This requires the construction of the feff.inp file for the reference compound, which can be done by the ATOMS code. After executing the FEFF code, the theoretical EXAFS signal should be extracted from the generated chi.dat file and compared with the experimental one. If the phases of two EXAFS signals deviate significantly, especially in the low-k range, one needs to adjust the E0 position for the experimental EXAFS signal. Thus, the whole extraction procedure should be repeated till the two EXAFS signals will be aligned with the accuracy of better than 0.5-1 eV. When the good position of E0 for the EXAFS spectrum of the reference compound is found, the same E0 value should be used for other EXAFS signals under analysis. As a result of the FEFF calculation for the reference compound, a set of feff****.dat files is also generated for all scattering paths. Each feff****.dat file can be used to generate by the EDAFEFF code a pair of files (amp****.dat and pha****.dat) containing the amplitude and phase shift functions in the format required by the EDAFIT and EDARDF codes. Here the asterisk symbol should be changed by the required scattering path number, for example, amp0001.dat. After proper selection of the E0 value, one can continue the analysis of the EXAFS spectrum for the system of interest. In many cases, due to the presence of the multiple-scattering contributions at large distances, only analysis of the first coordination shell of the absorber can be rigorously performed, i.e. without further significant approximations. To do this, one needs first to isolate the contribution of the first shell by performing direct and inverse Fourier transformations (FT) of the experimental EXAFS signal. This can be done by the EDAFT code. One should take care that exactly the same "windows"-function is used in k-space, and the "window"-function in R-space selects precisely the range of the first shell. The overlap with the outer shells in R-space, the noise and the presence of the phase shift must be taken into account to do the isolation procedure properly. Finally, the isolated first shell EXAFS signal can be best-fitted by the Gaussian or cumulant model using the EDAFIT code, or the first shell RDF function can be directly reconstructed by the EDARDF code. In both cases, the amplitude (amp****.dat) and phase shift (pha****.dat) functions must be provided. |
||||||||||||||||||||||||
| Downloads |
Download the presentation on "Practical approach to EXAFS data analysis" in PDF format. Download EDA Manual in PDF format.
Download the current version of the EDA package. (It works under Windows only!) |
||||||||||||||||||||||||
| Reference |
Main reference: A. Kuzmin, EDA: EXAFS data analysis software package, Physica B 208/209 (1995) 175-176. Please, cite this work in your publications based on the results of the EXAFS analysis by the EDA package. You can find more references on examples of the EDA application to different systems here. |

